Real Estate11/9/2026
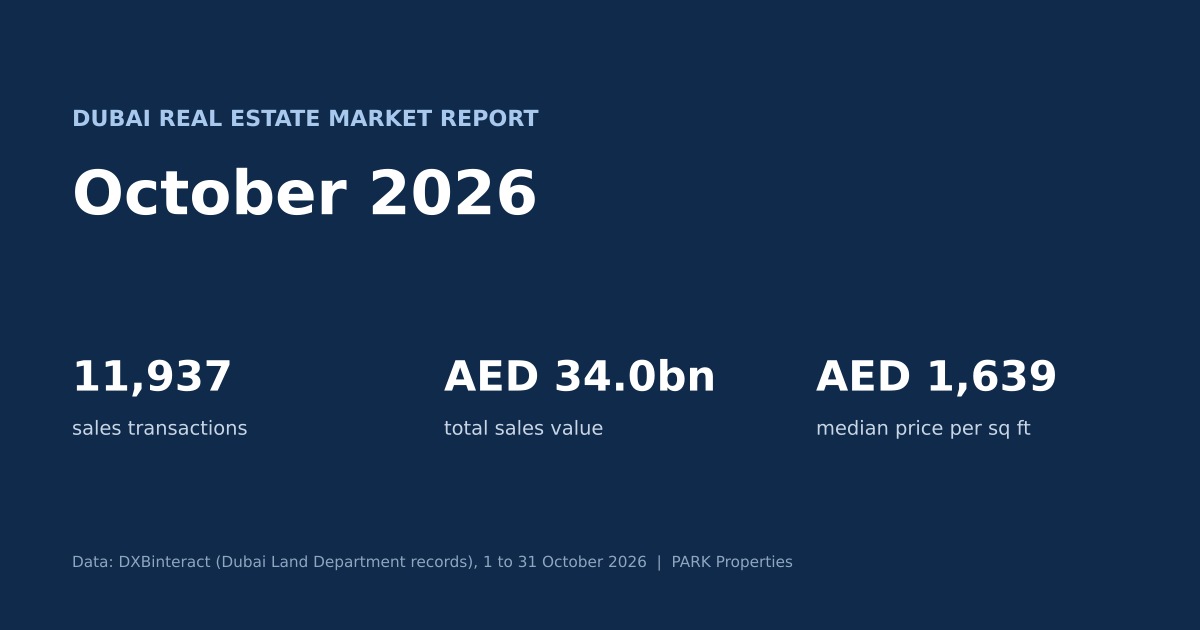
The Dubai real estate market in October 2026 recorded 11,937 property sales worth AED 34.0 billion, according to DXBinteract, which publishes Dubai Land Department transaction records. Sales were up 5.3% on September and value rose 14.4%. Compared with October 2025, however, transactions were down 39.9% and value was down 42.6%. The citywide median price per square foot was AED 1,639, about 1% lower than in September and 3.8% lower than a year earlier.
Three things stand out. Ready-property sales grew much faster than off-plan sales during the month. Villa sales jumped 63% from September. And the slowdown that began with regional conflict in late February is still visible in the year-on-year numbers, even as monthly activity steadies.
Dubai Real Estate Market Overview: October 2026
Metric (1–31 October 2026) | Value |
Total sales transactions | 11,937 |
Total sales value | AED 34.0 billion |
Median sale price | AED 1,394,000 |
Median price per sq ft | AED 1,639 |
Off-plan sales | 7,660 (64% of transactions) |
Ready-property sales | 4,277 (36% of transactions) |
Apartment sales | 8,942 (75% of transactions) |
Villa and townhouse sales | 2,011 |
Busiest area by transactions | Al Barsha South Fourth (JVC), 837 sales |
Source: DXBinteract, Dubai Land Department sale transactions. Figures cover registered sales only, not mortgages or gifts.
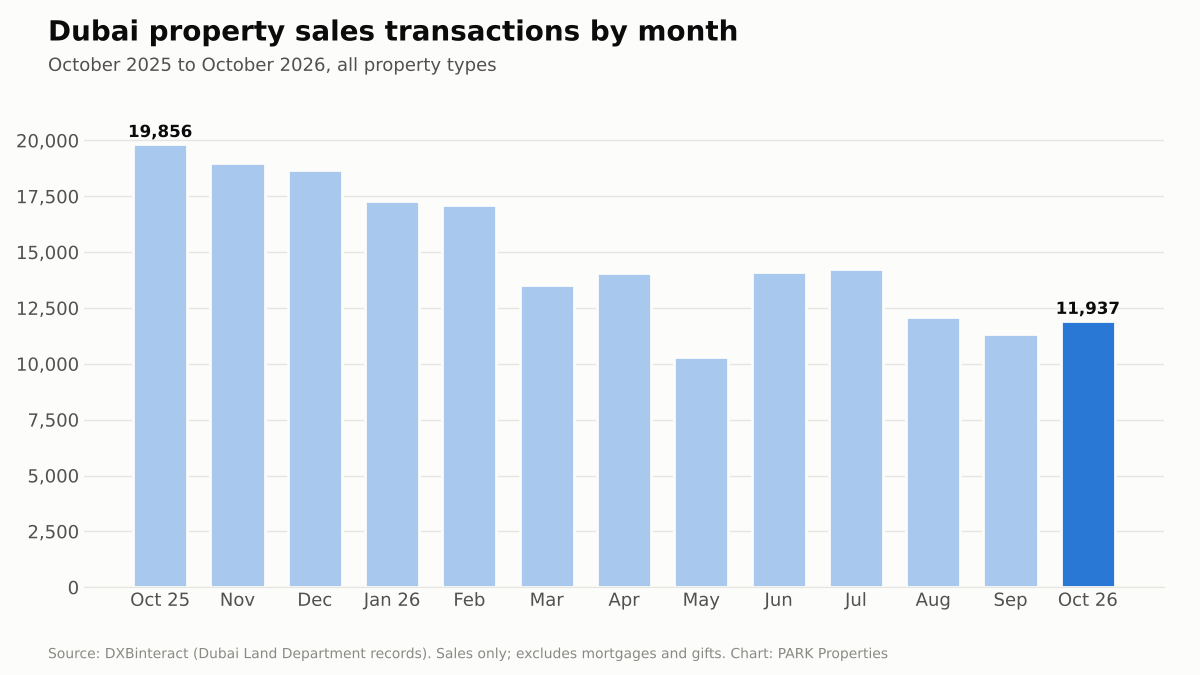
In short, October looks like a market that has found a floor in activity but has not recovered to 2025 levels. Monthly sales have stayed between roughly 11,300 and 14,300 since June. Prices measured per square foot have eased only slightly, which suggests that sellers and developers are adjusting through fewer launches and selective pricing rather than through deep cuts.
Dubai Property Sales and Transaction Value in October 2026
October's AED 34.0 billion in sales works out to an average of about AED 2.85 million per transaction. The median sale, at AED 1.39 million, is a better guide to a typical deal, because a small number of very large sales lift the average. The month's most expensive villa sale was AED 97 million in Hadaeq Sheikh Mohammed Bin Rashid (Dubai Hills Estate), and the top apartment sale was AED 55 million on Palm Jumeirah.
Value rose faster than volume compared with September, so buyers spent more per deal. Two segments explain most of that: villas (AED 9.1 billion, up from AED 6.4 billion) and land plots (AED 5.9 billion, up from AED 4.2 billion). Apartment value was broadly flat at AED 14.8 billion.
October 2026 vs September 2026: Month-on-Month Comparison
Metric | September 2026 | October 2026 | Change |
Sales transactions | 11,340 | 11,937 | +5.3% |
Sales value | AED 29.7bn | AED 34.0bn | +14.4% |
Median sale price | AED 1,337,615 | AED 1,394,000 | +4.2% |
Median price per sq ft | AED 1,656 | AED 1,639 | −1.0% |
Off-plan sales | 7,672 | 7,660 | −0.2% |
Ready sales | 3,668 | 4,277 | +16.6% |
October is the first month since July in which both sales count and value rose. The gain came almost entirely from ready property. Off-plan volumes held steady. A higher median sale price alongside a slightly lower price per square foot usually points to a change in what was sold, not to rising prices. In October, buyers bought more large units, especially villas. One month of growth is not a trend, but it does break the downward run of August and September. Our July 2026 Dubai market report gives the mid-year starting point for comparison.
October 2026 vs October 2025: Year-on-Year Performance
Metric | October 2025 | October 2026 | Change |
Sales transactions | 19,856 | 11,937 | −39.9% |
Sales value | AED 59.2bn | AED 34.0bn | −42.6% |
Median sale price | AED 1,450,000 | AED 1,394,000 | −3.9% |
Median price per sq ft | AED 1,703 | AED 1,639 | −3.8% |
Off-plan sales | 13,552 | 7,660 | −43.5% |
Ready sales | 6,304 | 4,277 | −32.2% |
New units launched | 17,300 | 6,128 | −64.6% |
The annual comparison is against an exceptionally strong month: October 2025 was one of the busiest Octobers on record. The decline reflects the regional conflict that began in late February 2026. The National reported that S&P Global Ratings, using Dubai Land Department data, found sales averaged 12,644 a month from March to September, 26% below January and February. October's 11,937 sits slightly below that average.
Two points put the drop in proportion. First, transactions fell by about 40% but the median price per square foot fell by under 4%. Volume has corrected far more than price. Second, developers have pulled back sharply. Units launched in October were almost two-thirds lower than a year earlier, which limits new supply competing for buyers.
Dubai Property Prices per Square Foot in October 2026
Segment | Median price per sq ft, October 2026 |
All Dubai sales | AED 1,639 |
Off-plan | AED 1,701 |
Ready | AED 1,440 |
Apartments | AED 1,669 |
Townhouses | AED 1,575 |
Villas | AED 1,359 |
Commercial | AED 2,271 |
These are medians across very different properties. A Dubai-wide figure does not describe any single community or unit type. Villas show a lower median price per square foot than apartments because they are larger and often further from the city centre. The villa figure also fell sharply this month because 429 off-plan villa sales were registered in one outer community, Al Rowaiyah First, at relatively low rates per square foot.
Off-plan homes sold at a median 18% premium per square foot over ready homes. That gap partly reflects newer specifications and payment-plan pricing, but it also means an off-plan buyer pays more per square foot today for a unit that will not produce rent until handover.
Off-Plan vs Ready Property Sales in October 2026
Metric | Off-plan | Ready |
Transactions | 7,660 | 4,277 |
Share of transactions | 64.2% | 35.8% |
Sales value | AED 17.5bn | AED 16.5bn |
Share of value | 51.5% | 48.5% |
Median sale price | AED 1,323,554 | AED 1,675,000 |
Change in transactions vs September | −0.2% | +16.6% |
Change in transactions vs October 2025 | −43.5% | −32.2% |
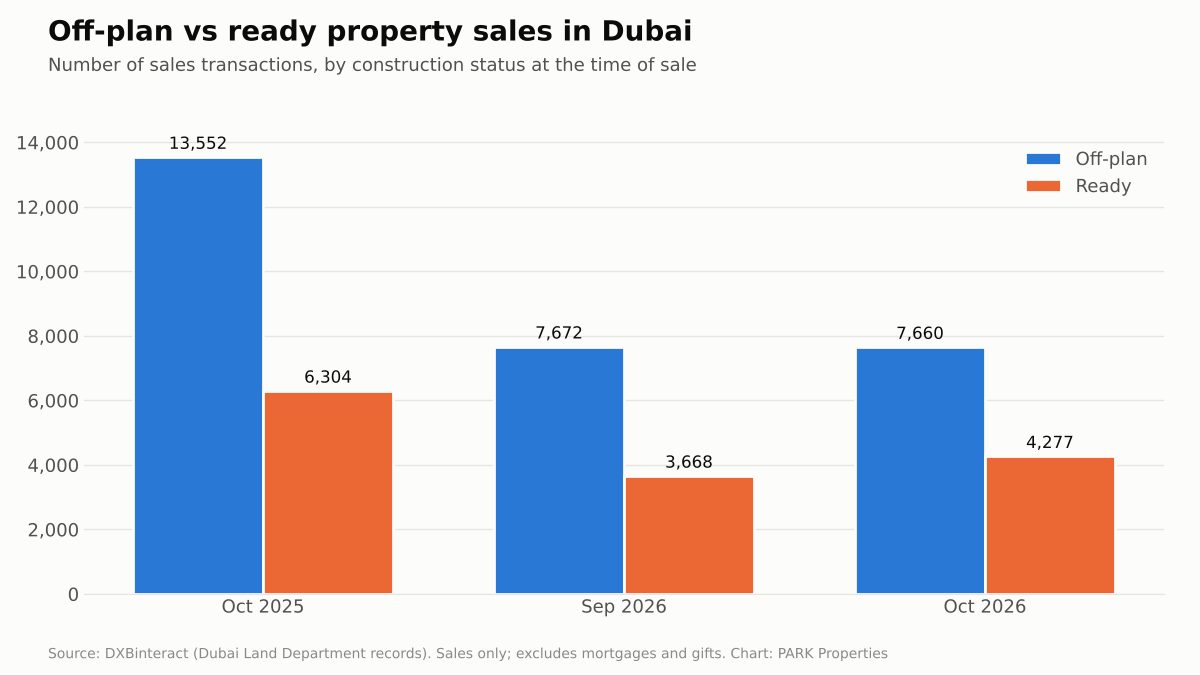
Off-plan still accounts for most deals, but its share of transactions has fallen from 68.3% in October 2025 to 64.2%. Ready property has held up better over the year and drove October's monthly gain.
It helps to separate two splits that are often mixed up. Off-plan vs ready describes the construction stage. Developer (primary) vs resale describes who is selling. In October, developers sold 7,609 units worth AED 19.2 billion and existing owners resold 4,328 worth AED 14.8 billion. Developer sales include some completed stock, and resales include some off-plan units sold on before handover.
For buyers, the practical trade-off is unchanged. Off-plan offers staged payments and a lower entry price but carries construction, delivery and resale-timing risk. Ready property costs more upfront but can be inspected and rented immediately. Our guide to off-plan vs ready properties in the UAE sets out the full comparison. Anyone buying off-plan should also understand Oqood registration and its fees in Dubai before signing.
Apartment, Villa and Townhouse Sales Performance
Property type | Transactions | Value | Median price | vs Sep 2026 (transactions) | vs Oct 2025 (transactions) |
Apartments | 8,942 | AED 14.75bn | AED 1,149,000 | −2.0% | −44.8% |
Villas | 1,362 | AED 9.10bn | AED 4,069,819 | +63.1% | +6.0% |
Townhouses | 649 | AED 2.02bn | AED 2,994,000 | +8.0% | −48.9% |
Commercial | 540 | AED 2.27bn | AED 2,113,730 | 0.0% | −21.5% |
Plots | 443 | AED 5.87bn | AED 5,629,183 | +90.1% | +14.5% |
Villas were the only residential type to record more sales than in October 2025. Most of the increase came from developer launches in outer communities such as Al Rowaiyah First and Al Yufrah 1, so it is concentrated in a small number of projects rather than spread across the market. Apartments, which make up three-quarters of all deals, were slightly weaker than in September and well below last year. That matters because apartments are the main product for first-time buyers and yield-focused investors.
Top-Performing Dubai Areas in October 2026
Rank | Area (official DLD name) | Sales transactions | Area | Sales value |
1 | Al Barsha South Fourth (JVC) | 837 | Business Bay | AED 1.74bn |
2 | Dubai South | 784 | Al Rowaiyah First | AED 1.10bn |
3 | Wadi Al Safa 3 | 509 | Palm Jumeirah | AED 1.03bn |
4 | Business Bay | 457 | Hadaeq Sheikh Mohammed Bin Rashid (Dubai Hills) | AED 1.02bn |
5 | Jabal Ali First | 457 | Wadi Al Safa 3 | AED 0.96bn |
Rankings cover apartments, villas and commercial units. DXBinteract uses official Dubai Land Department area names, which can include several marketed communities.
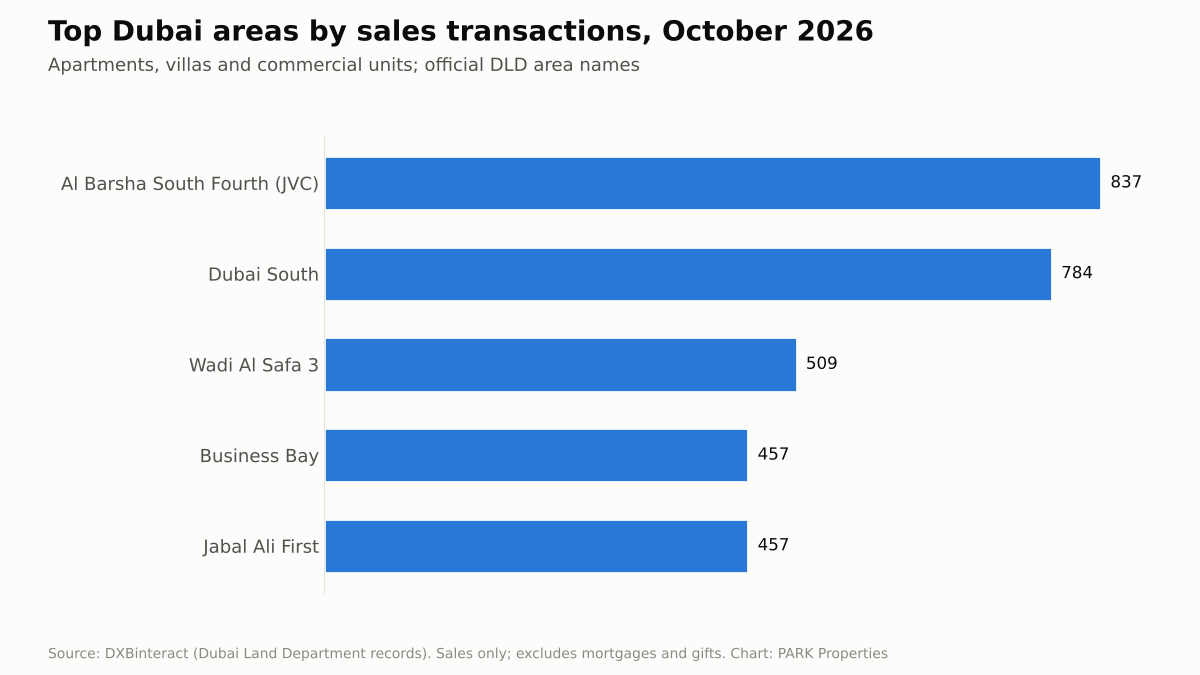
The two rankings tell different stories. The busiest areas by transaction count, JVC and Dubai South, are mid-market, apartment-led and heavily off-plan. Dubai South recorded 713 developer sales alone. The highest-value areas are a mix of prime locations (Business Bay, Palm Jumeirah, Dubai Hills) and one large villa launch (Al Rowaiyah First). Business Bay is the only area in the top five on both lists.
A high transaction count shows liquidity and buyer interest. It does not mean higher returns. Busy areas often have the most new supply, which can hold back rents and resale prices once projects complete. For a wider view of where off-plan demand is concentrating, see our guide to Dubai's emerging off-plan areas in 2026.
What October 2026 Market Performance Means for Property Investors
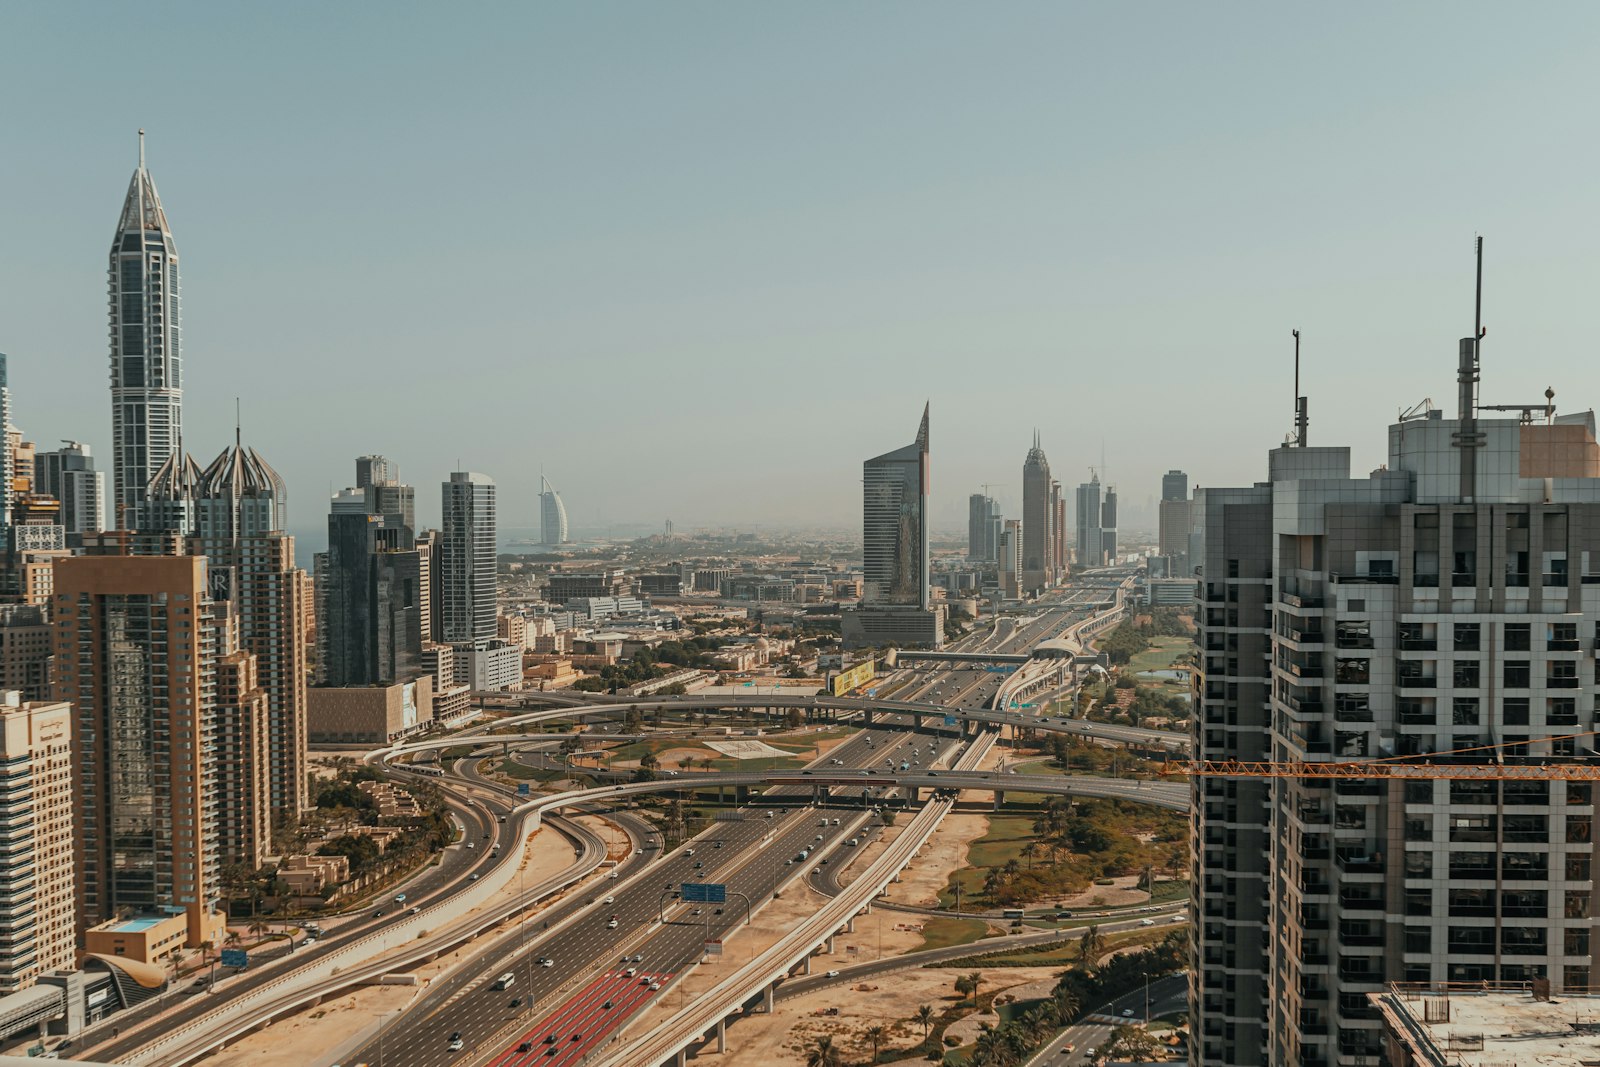
The data supports a few practical conclusions. The rest is judgement.
- Prices have been stickier than volumes. A 40% fall in transactions with a sub-4% fall in median price per square foot means sellers are mostly waiting rather than discounting. Buyers looking for deep citywide discounts are not seeing them in the data, although individual negotiated deals may differ.
- Rents are softening for new tenants. The median new apartment lease in October was AED 67,815 a year, 5.8% lower than a year earlier, while renewals rose 4.9%. Investors should model yields on new-lease rents rather than on last year's figures.
- Supply is still arriving. 2,289 units were handed over in October, and the launch pipeline from 2024 and 2025 is still completing. S&P has said it expects apartment prices to correct faster than villa prices because of this pipeline.
- Liquidity varies by segment. Ready resales rose in October, but areas with heavy off-plan supply may take longer to absorb resale stock at handover.
- Financing and costs still apply. Budget for DLD fees, service charges and, for off-plan, the gap between payment-plan instalments and rental income.
Before committing, it is worth reviewing the common mistakes to avoid when investing in UAE property, particularly on developer due diligence and exit planning.
Al Warsan Fourth and Relevant Park Properties Communities
Al Warsan Fourth (marketed as Warsan 4) is the Dubai community where PARK Properties is active. The October figures below come from DXBinteract's area-level data and are separate from the Dubai-wide numbers above.
Al Warsan Fourth | October 2025 | September 2026 | October 2026 |
Sales transactions | 163 | 114 | 130 |
Median sale price | AED 759,000 | AED 800,000 | AED 851,000 |
Median price per sq ft | AED 1,040 | AED 1,190 | AED 1,270 |
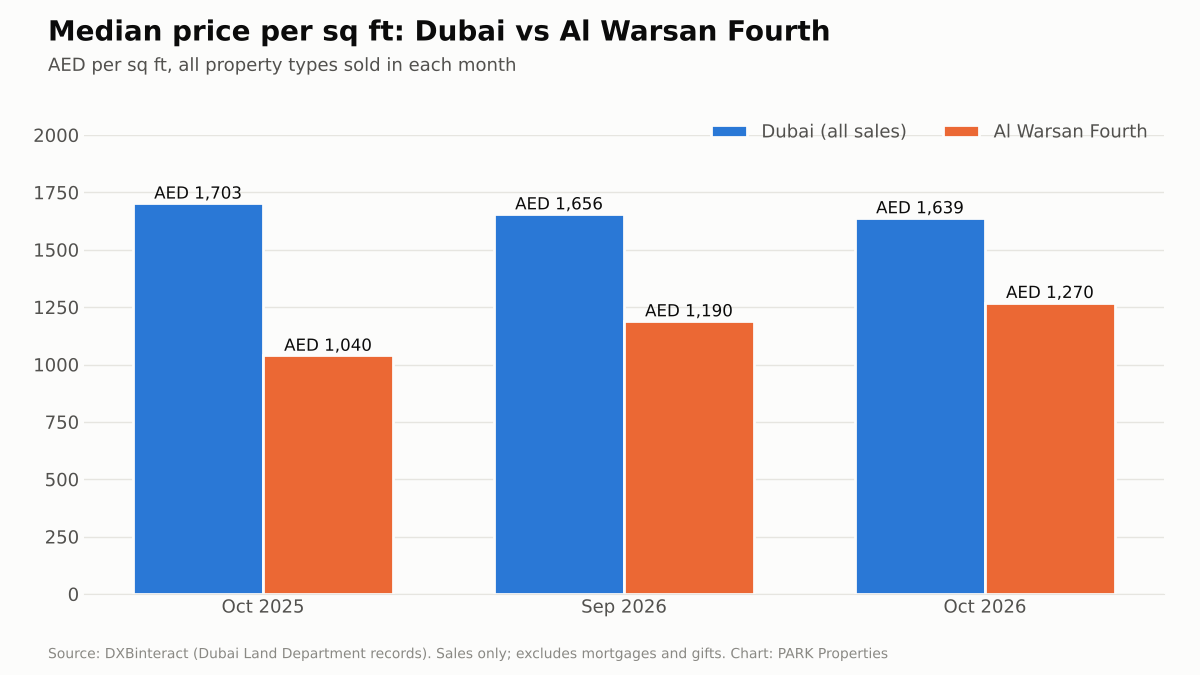
Al Warsan Fourth recorded 130 sales in October, 95 of them off-plan. Activity was 14% higher than in September and 20% lower than a year earlier, a smaller annual fall than the citywide 40%. The median price per square foot of AED 1,270 is about 23% below the Dubai median, which explains why the area attracts budget-focused buyers and investors seeking rental income. DXBinteract estimates its gross rental yield at around 9%.
The 22% annual rise in median price per square foot needs care. With only 130 deals, a shift towards newer off-plan units can move the median as much as genuine price growth. Off-plan units sold at a median AED 1,330 per sq ft in October, compared with AED 1,130 for ready units. Supply is also rising: two completed buildings in the area, Moonsa Residences (93 units) and Equiti Tower (88 units), were handed over in October. Our assessment of the risks and rewards of investing in Warsan Fourth covers oversupply and resale depth in more detail.
Longer-term drivers include the planned Dubai Metro Blue Line and its expected impact on Warsan Fourth, though its benefits sit several years out. Buyers comparing new launches can use our side-by-side comparison of new projects in Warsan 4, which includes PARK Residency, our studio, one- and two-bedroom development in the area.
Dubai Real Estate Market Outlook After October 2026
What the data shows: monthly sales have stayed between about 11,300 and 14,300 since June, ready-property sales are recovering faster than off-plan sales, new launches are well below 2025 levels, and the median price per square foot has drifted down by less than 4% over the year.
What this may mean (interpretation, not forecast): if regional conditions stay calm, the lower launch pipeline could help existing off-plan stock sell through, and resale activity may keep improving into the cooler months. The main risks are a renewed escalation in the region, apartment handovers that push new-lease rents lower, and buyers holding back while they wait for clearer price direction. Cavendish Maxwell, quoted by The National, said near-term activity will depend on project launches, regional uncertainty and buyer normalisation.
Buyers should treat month-to-month swings with caution and base decisions on area-level data, rental demand and holding period. You can browse current apartments for sale in Al Warsan 4 or contact the PARK Properties team for area-specific figures.
Data and Methodology
All figures are registered sale transactions for 1–31 October 2026 from DXBinteract, which draws on Dubai Land Department records. Mortgages, gifts and other procedures are excluded. Comparison periods (September 2026, October 2025) use the same filters. "Median price per sq ft" is DXBinteract's citywide measure. The average value per sale is calculated by dividing total value by transaction count. Totals published elsewhere may differ slightly because of reporting cut-off dates and different off-plan and ready classifications. Raw transaction data is available from the Dubai Land Department's open data portal.
Frequently Asked Questions
How many properties were sold in Dubai in October 2026?
Dubai recorded 11,937 property sales transactions between 1 and 31 October 2026, according to DXBinteract data from Dubai Land Department records. That was 5.3% more than September 2026 (11,340) and 39.9% fewer than October 2025 (19,856). The figure covers sales only, not mortgages or gifts.
What was the total value of Dubai property sales in October 2026?
Sales in October 2026 were worth AED 34.0 billion, up 14.4% from AED 29.7 billion in September but 42.6% below the AED 59.2 billion recorded in October 2025. The median sale price was AED 1,394,000, while the average value per sale was about AED 2.85 million because a few very large deals lift the average.
Did Dubai property sales increase compared with September 2026?
Yes. Transactions rose 5.3% and value rose 14.4%. The increase came mainly from ready property, where sales grew 16.6% to 4,277, and from villas, which rose 63% to 1,362. Off-plan sales were flat at 7,660. One month of growth does not confirm a recovery, but it ended two months of decline.
Which Dubai communities recorded the most property sales?
By transaction count, Al Barsha South Fourth (Jumeirah Village Circle) led with 837 sales, followed by Dubai South (784), Wadi Al Safa 3 (509), Business Bay (457) and Jabal Ali First (457). By sales value, Business Bay led with AED 1.74 billion. These rankings cover apartments, villas and commercial units.
How did off-plan sales compare with ready-property transactions?
Off-plan sales totalled 7,660 transactions worth AED 17.5 billion, 64% of all deals. Ready sales reached 4,277 worth AED 16.5 billion. Ready property grew faster in October (+16.6% month on month) and fell less over the year (−32.2% vs −43.5% for off-plan). Off-plan units sold at a median AED 1,701 per sq ft, against AED 1,440 for ready units.
What happened to Dubai property prices in October 2026?
The citywide median price per square foot was AED 1,639, down 1.0% from September and 3.8% from October 2025. The median sale price rose 4.2% month on month to AED 1,394,000, mainly because more large villas were sold. Prices vary widely by community and property type, so the citywide median is not a valuation for any specific home.
Is transaction growth the same as price appreciation?
No. Transaction growth means more properties changed hands. Price appreciation means the same type of property sold for more. In October, sales rose 5.3% while the median price per square foot fell 1%. Over the year, transactions fell about 40% but the median price per square foot fell under 4%. Busy areas are not necessarily the ones gaining value.
What should investors consider after reviewing the October data?
Focus on area-level prices, current new-lease rents rather than last year's, upcoming handovers in the community, developer track record, resale liquidity and total costs including DLD fees and service charges. Off-plan buyers should check payment schedules against their own cash flow. Citywide figures are a starting point, not a substitute for project-level due diligence.